Editor’s Note: TheMaxar 2018 Australia Sustainability Hackathon aimed to address Australia’s most conflicting issues surrounding mining, agriculture and environmental sustainability using machine learning and satellite imagery. This blog post is written by the winning team from the agriculture category.
The forestry industry can benefit from multi-spectral, high-resolution satellite imagery in a number of ways, particularly for inventory components, such as tree stocking assessment, Leaf Area Index (LAI) estimation, volume survey and health analysis at stand and individual tree level. These could be measured in direct way through sampling. However, direct methods are very labor intensive, costly and subject to sampling error.Image-based remote sensing and advanced artificial intelligence (AI) technology offer an affordable solution to this problem. While previous satellite sensors lack sufficient spatial resolution necessary for accurate inventory survey, the latest high-resolution sensors like Maxar’s WorldView-2, WorldView-3 & WorldView-4 satellites with an unprecedented 30 cm – 50 cm spatial resolution are ideal for this purpose. In addition to this, WorldView-3 has eight spectral bands, providing a better distinction between natural and man-made objects. These advanced capabilities open up a whole new world of opportunities for the forestry industry and remote sensing scientists. Given the large-scale coverage of satellite imagery and low cost of data acquisition, it offers an affordable solution compared to other existing remote sensing technologies such as manned and unmanned aerial vehicles as well as LiDAR.Recently, the Mapizy team competed in the Maxar 2018 Australia Sustainability Hackathon and processed WorldView-3 imagery of a test-site in Albany, Australia to produce an accurate tree stocking map of young plantations and their health assessment. The project area as shown in Figure 1 represents several plantation farms from two to five years old.
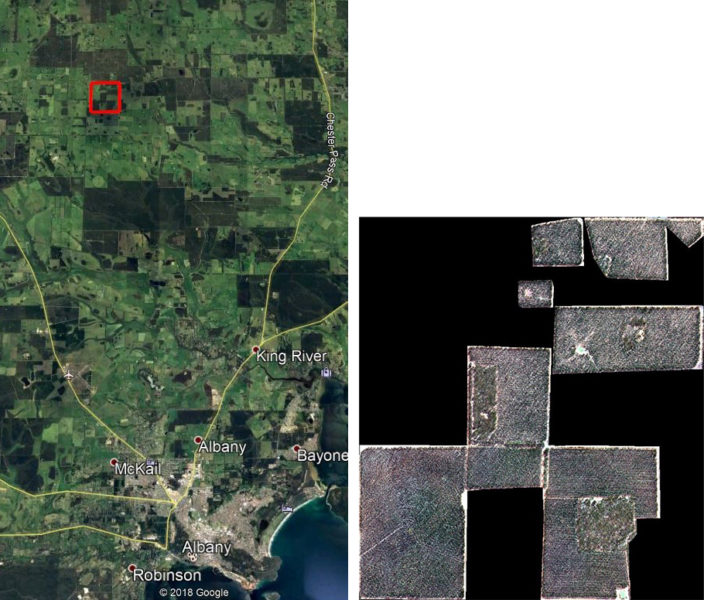
Our solution uses satellite images and the boundary of plantation farms if available as input and produces a range of analytics such as tree stocking, health analysis and tree species recognition, if required as output. Plantations growing a single tree type don’t require species recognition, but a plantation with different types of trees needs the types recognized and counted separately. Below is a brief overview of the processing procedure. First, a generic tree crown model is generated by averaging various crowns collected from various locations within the farms. Next, a machine learning model is used to identify the area covered by trees. This mask (see Fig. 2) is used to remove trees incorrectly identified.

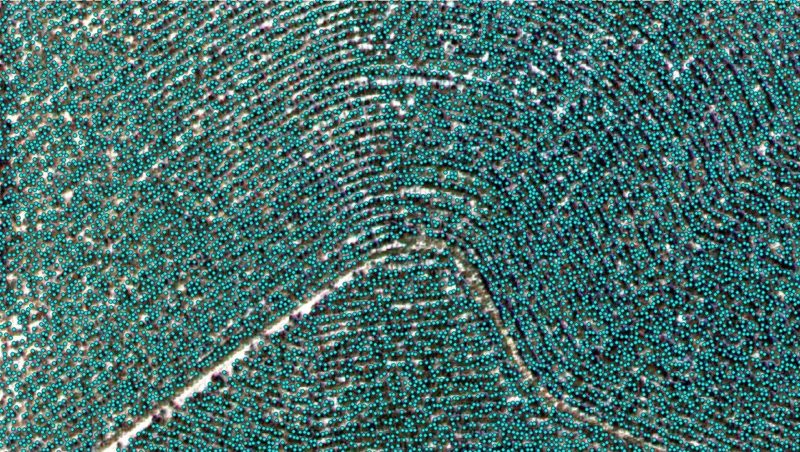
After that, tree-tops will be identified through a matching process where tree crowns will be assessed against the model previously generated. Finally, geometric properties such as tree rows and distances between trees are used to further enhance the result. An example result is shown in Fig. 3.
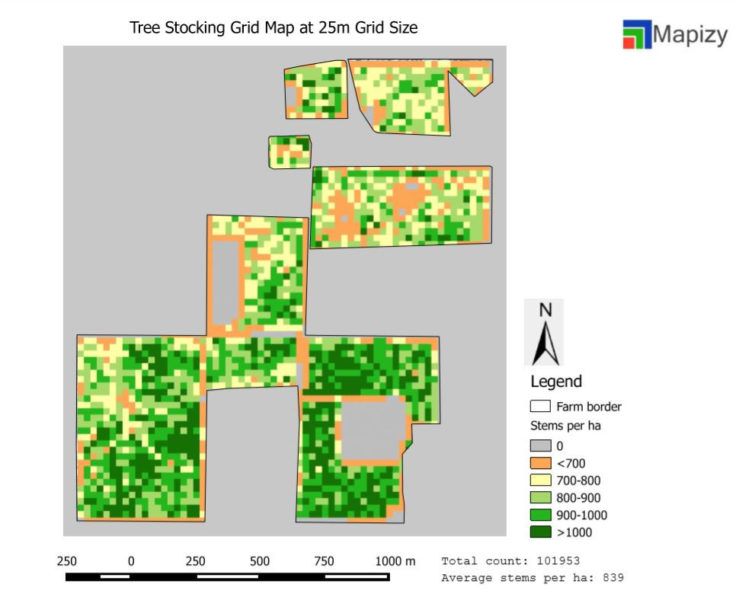
The final tree stocking map is shown in Fig. 4 where the number of trees per hectare is displayed in a grid map of 25m cell size. In addition to the map, a range of statistical information can be derived from the counting the results for each farm such as mortality rate and health assessment at individual tree level. Our inventory result was confirmed to be >93% accurate and validated using field observation collected at sample plots by our industry partners.