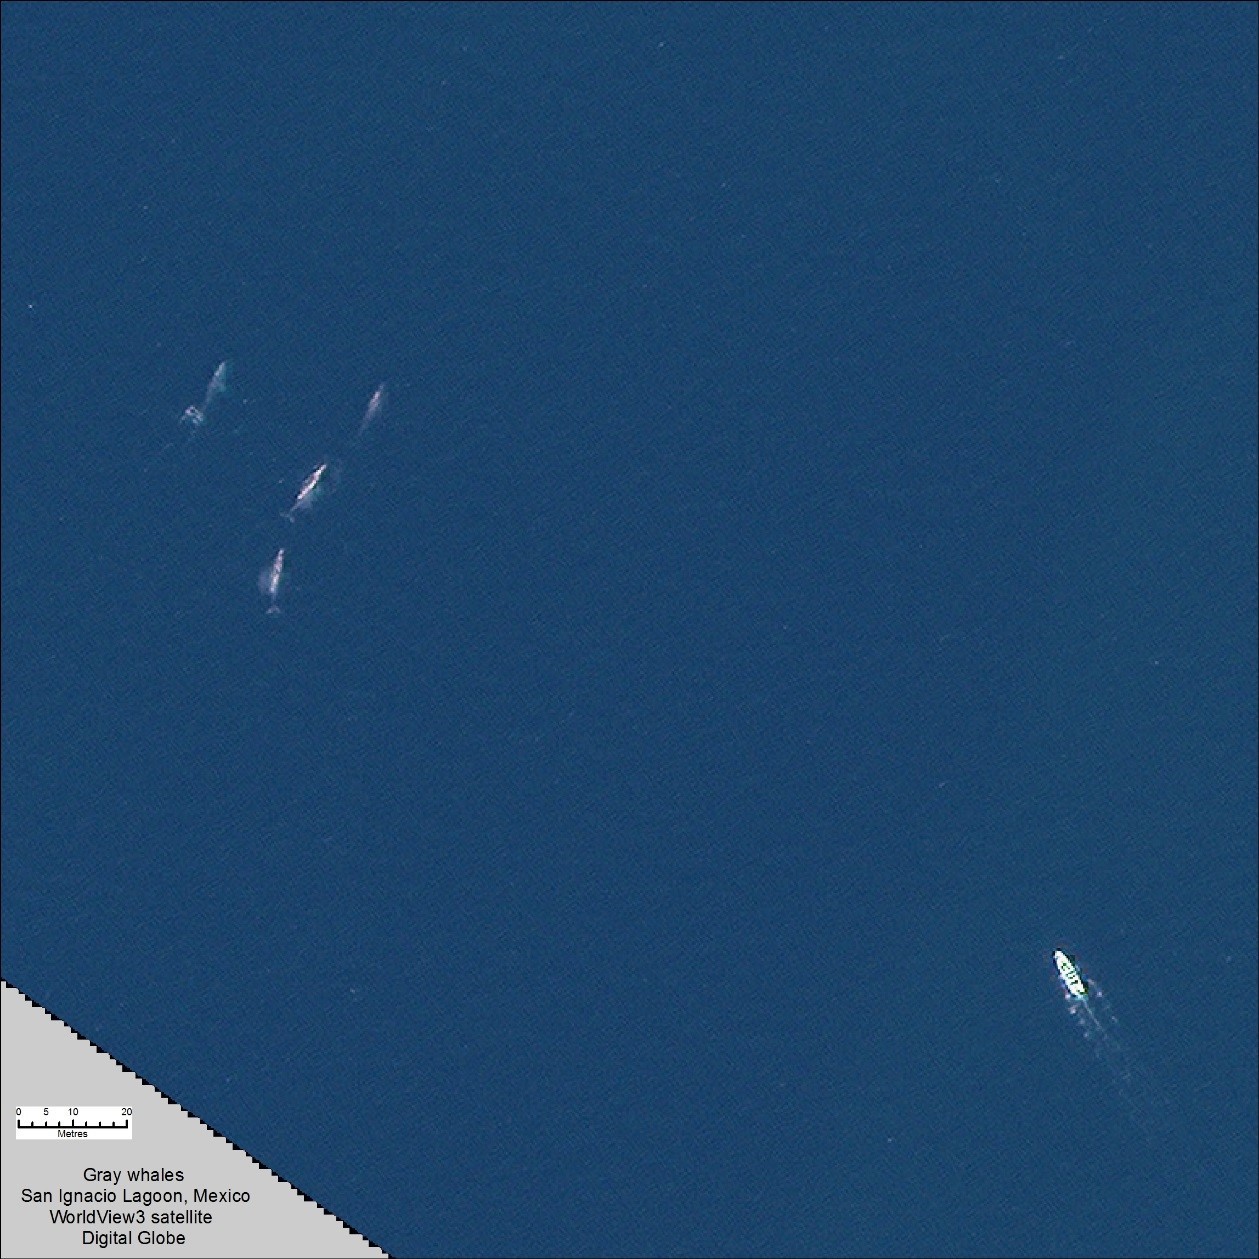
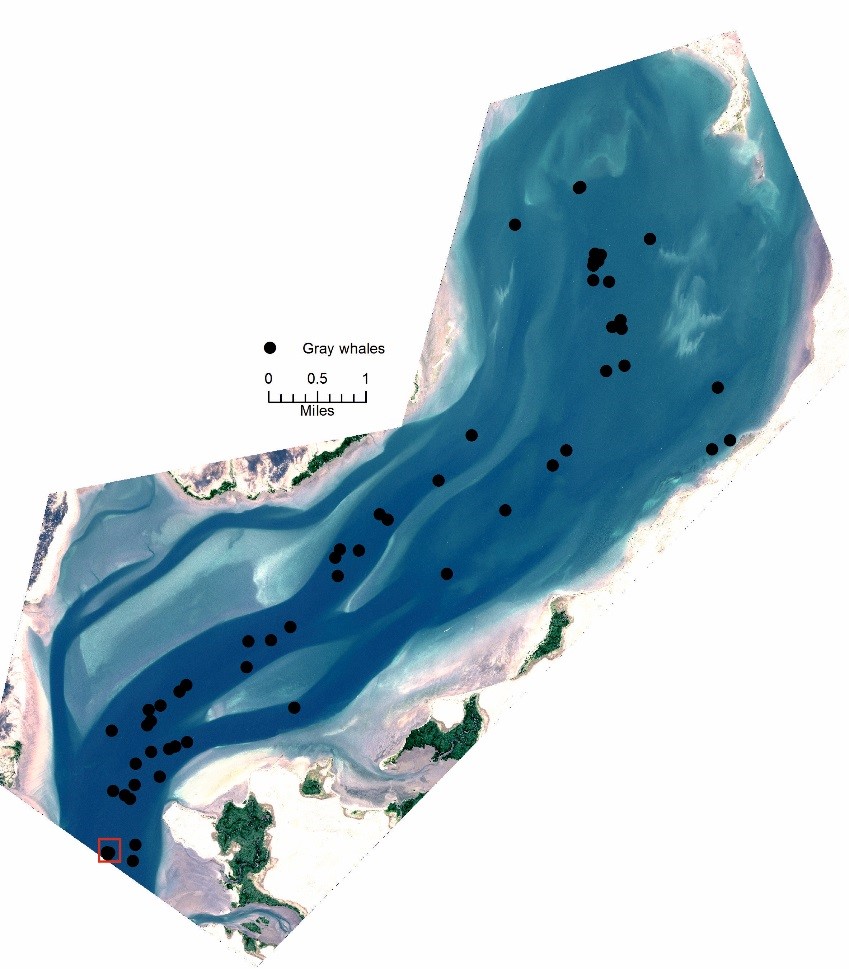
When I first downloaded the very high resolution satellite image (shown below) from the Maxar FTP server, I was thrilled by what I could see captured from 300-plus miles up: 60 gray whales in the San Ignacio Lagoon in Baja California, Mexico, an area where gray whales go to give birth. In the calm waters, the whales are obvious and distinct, easy to count in WorldView-3 satellite imagery. Even when they are several feet below the surface, the whales are quite visible and easy to differentiate from fishing and whale-watching tourist boats also in the lagoon.
Counting whales from space is a new idea, and an exciting one. For the past few years, my team at the British Antarctic Survey has been investigating the use of high-resolution satellite imagery to count and monitor whales, beginning with baleen whales. We first focused on southern right baleen whales around Peninsula Valdes in Argentina. Theoretically, right whales should be easy to find. Although there are only a few thousand of them left in the world, they all breed in concentrated groups in a few well-known locations. They prefer calm waters, and the mothers spend most of their time near the surface. We figured that right whales might yield the best chance of success, and we were correct. For that project, we used 50 cm imagery from WorldView-2. And in 2014, we published our first scientific paper—the first research to demonstrate that satellite imagery could be effective in counting whales. We had a huge response from the whale and conservation community who were eager to embrace the new technology—and for good reason. The numbers of many whale populations are poorly understood. Estimating whale populations by traditional means—aerial or boat survey—is expensive, especially in the remote areas where many whales breed. The use of satellites to monitor remote whale populations could be a transformative tool to track, count and monitor the health of these charismatic animals. Humanity has driven many large species of whales to the brink of extinction through industrial whaling. At this crucial time, our governments, fisheries and conservation bodies are keen to know whether whale populations are increasing or if ship strikes, pollution and climate change are diminishing their numbers.
Our research expanded to other species and higher resolution imagery. Now we use 30 cm imagery from the WorldView-3 satellite. Even with an animal that can be 100 feet long, the difference in resolution between 50 cm and 30 cm per pixel can make all the difference to a successful count. So far we have imagery of four species: southern right from Peninsula Valdes, humpbacks from Maui, gray whales from Baja in Mexico and fin whales in the Pelagos Marine Sanctuary in the Mediterranean. The main limitation of the technique is the state of the sea. Choppy waters with whitecaps make it impossible to see whales under the surface, so we have restricted our initial analysis to areas with calmer waters, often bays and estuaries. We plan to publish a paper later this year with details of the spectral reflectance of each species with a view to automating the process of finding whales from very high resolution satellite data. Our next priority is Object-Based Image Analysis and Machine Learning with which we will create a toolbox for the conservation community to count whales by very high-resolution satellite imagery. This will be a key step forward to speed the process, since most species wander over the vast swathes of ocean. Checking several thousand square miles of flat ocean at pixel resolution can be a tedious task. An interesting insight to emerge from our present study is that the best way to count whales varies by species. Some whales are easier to track by boat, others from miles overhead. Which whales to count by high-resolution imagery is just one more question we hope to answer soon. More on that later.
Peter Fretwell is a Geographic Information Officer with the British Antarctic Survey. His work currently involves geospatial analysis and applied remote sensing across a range of environmental fields. Recently, his focus has been on the use of very high resolution satellite imagery to count and study wildlife, and the construction of digital elevation models such as the Bedmap2 project, which mapped the bed topography of Antarctica. He also supports BAS science and logistics with mapping and geospatial analysis and updating the Antarctic Digital Database. The British Antarctic Survey received a Maxar imagery grant in 2016 to help support its ongoing research.